# Massachusetts Housing Snapshot: Which Dorchester MA Neighborhoods Are Holding Pricing Power in 2026?
What are the key takeaways?
•The short answer: The Dorchester MA neighborhoods holding pricing power right now are Savin Hill, JFK/UMass, and Ashmont — walkable, Red Line-connected pockets where buyer demand still outpaces what little new supply has actually been built nearby.
•The supply context: Greater Boston's recent multifamily deliveries have skewed toward luxury corridors like Seaport, Assembly Square, and the East Boston waterfront — not the mid-priced Red Line south corridor where rate-squeezed buyers want to live.
•The rate reality: Nationally, Freddie Mac's Primary Mortgage Market Survey reports a 6.61% average 30-year mortgage rate. At that level, the suburban "more house for your money" trade from 2020–2022 no longer pencils out for many single commuters.
•The wild card: The November 2026 statewide rent control ballot could cut both ways for Dorchester buyers. Historically, supply caps freeze new construction (boosting existing-home scarcity) but also depress property values, as Worcester officials have publicly projected.
If you've been searching Dorchester MA neighborhoods this spring, you've probably felt the pressure firsthand.
Savin Hill homes near the Red Line still move fast. Condos around JFK/UMass remain competitive. Two-families in Ashmont continue drawing serious owner-occupant interest — buyers who plan to live in the home rather than hold it purely as an investment. Meanwhile, the old suburban math is quietly unraveling.
For years, buyers traded commute time for more space and came out ahead. With the 30-year mortgage rate now sitting at 6.61% (Freddie Mac PMMS, 2026), that trade is harder to justify. The headline sounds like relief: Greater Boston has added a meaningful wave of new multifamily housing over the past year. But here's the catch.
New supply only cools prices where it actually gets built.
In the walkable, Red Line-connected parts of Dorchester where buyers most want to be, very little of that new supply arrived.
A quick note on what pricing power actually means: it's how much of their asking price sellers can hold without cutting. When pricing power is strong, homes sell at or above list. When it weakens, you see price reductions, longer days on market — the time a home sits listed before going under contract — and more concessions flowing toward buyers.
How did Greater Boston get to this supply squeeze?
This didn't happen overnight. The housing pipeline drifted away from everyday buyer demand over the better part of a decade.
•2015–2019: Luxury high-rises clustered in Seaport, Back Bay, and Kendall Square. Most of that housing was priced for investors or high-income renters, not local homeowners.
•2020–2022: Sub-3% mortgage rates pushed buyers into Middlesex and Norfolk County, and suburban prices ran up sharply.
•2023–2025: Rates climbed above 6%. Suburban move-up buyers pulled back. Builders began looking harder at Dorchester, East Boston, and Allston transit corridors — but much of the new product still skewed expensive.
That trajectory matters for your wallet. If the new homes being built aren't near your train stop, they don't solve your housing problem. The same is true if they fall outside your price range or don't match the type of home you're actually looking for.
Where did the new supply actually land?
Most new deliveries went to markets that already had substantial luxury rental inventory — Seaport/Fort Point, Western Ave in Allston-Brighton, the East Boston waterfront, Assembly Square in Somerville. Those areas matter. They just don't directly address demand in the Red Line south corridor.
The missing supply is in places like:
•Savin Hill
•JFK/UMass
•Ashmont
•Fields Corner
•Fairmount Line neighborhoods
These are the exact walkable, mid-priced pockets that first-time buyers and owner-occupants are watching every weekend. Dorchester's median listing price explains why demand keeps rotating here. At $665,000, Dorchester sits well below comparable Boston neighborhoods in the same Realtor.com dataset — Jamaica Plain at $847,000 and East Boston at $687,000, for example.
Boston Neighborhood Listing Prices and Inventory
Compares median listing price, price per square foot, and active for-sale inventory across selected Boston neighborhoods using 2026 Boston/Suffolk County housing market data.
| Category | Median Listing Price | $/Sq Ft | Active For Sale |
|---|---|---|---|
| Dorchester | $665,000 | $538 | 164 |
| Jamaica Plain | $847,000 | $676 | 89 |
| East Boston | $687,000 | $697 | 144 |
| South Boston | $1,124,500 | $908 | 270 |
| South End | $1,099,000 | $1,130 | 200 |
| Back Bay | $1,825,000 | $1,426 | 172 |
Source: Realtor.com, Boston neighborhood listing data (neighborhood-level within Suffolk County).
The Realtor.com data shows 164 active for-sale listings in Dorchester as of the snapshot. Without a verified inventory comparison to this time last year, the active count and median price speak for themselves — no need to layer in a growth figure that can't be sourced here.
Why is the commuter math changing?
This is the part many buyers feel before they can fully articulate it.
A buyer choosing a Dorchester two-family over a Milton single-family often borrows less. At today's rates, that gap in monthly principal and interest can run into the hundreds of dollars — before factoring in gas, tolls, a second car, or the time cost of sitting in traffic. Run the exact numbers with your lender; the direction matters more than any single figure.
Then add the Red Line. Savin Hill to the Financial District runs roughly 15 minutes during off-peak service. For many commuters, that compares favorably with driving from Route 3 South.
The lifestyle math has shifted. If you want walkable coffee, transit access, the beach at Tenean, and no second car, the city pocket may now make more sense than the suburb. That's the commuter squeeze in practice. Inner suburbs aren't collapsing — they've simply lost some of the buyers who used to stretch for them.
Why are parks and walkability protecting pricing power?
Walkability has moved from "nice to have" to a genuine pricing factor.
Citywide, 92% of Boston residents say their closest park is within an easy 10–15 minute walk. That's a city-level proxy, not a Dorchester-specific measurement, but it reflects a Boston-wide buyer preference that consistently benefits transit-adjacent neighborhoods.
How Residents Perceive Access to Parks and Recreation Assets
Survey-based agreement levels for walking access to parks and selected citywide recreation assets.
And 43% of Boston residents strongly agree that neighborhood parks were an important reason they chose where they live — the single largest response category. Like the 92% figure, this is a citywide Boston response rather than a Dorchester-specific one.
Parks as a Factor in Residential Location Decisions
Responses to the statement that neighborhood parks were an important reason for choosing the respondent’s current residence.
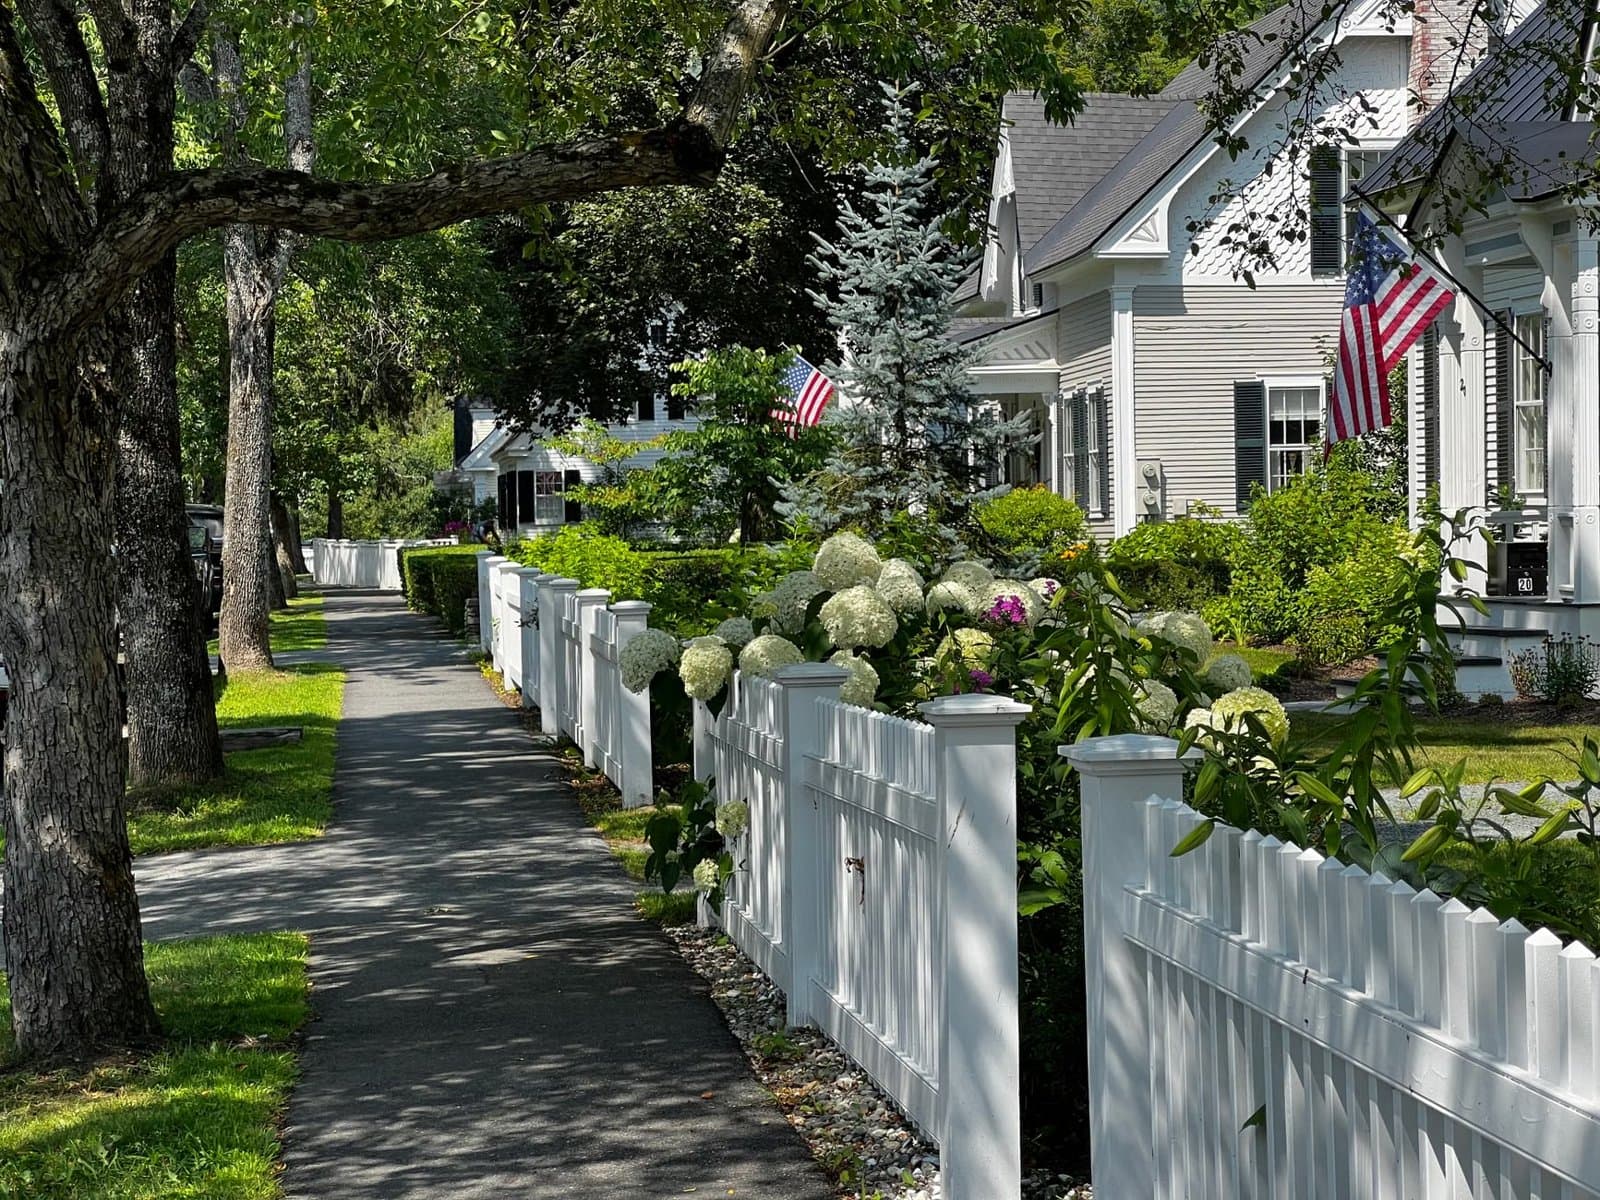
For Savin Hill homes near Malibu Beach, or Ashmont properties near Peabody Square, this isn't just curb appeal. It's daily life. Buyers are paying for shorter commutes, easier errands, nearby green space, and a neighborhood they can actually use without getting in a car. That puts a real floor under prices in transit-adjacent Boston neighborhoods.
Which submarkets should buyers and sellers watch in June 2026?
Is Savin Hill still one of the strongest Dorchester bets?
Yes — and geography is the primary reason.
The peninsula limits how much new housing can realistically be added, which protects existing homes from sudden oversupply. Layer in Red Line access, streets with genuine owner-occupant demand, and proximity to the water, and you have a submarket with durable appeal. For sellers, well-prepared listings can still command serious attention. For buyers, the right home moves quickly — be ready before it hits.
Is JFK/UMass and Columbia Point a buy-before-the-next-wave area?
It can be, but only for buyers with a longer hold horizon.
The Bayside redevelopment is real, and much of that product is 2027–2028. That's directly competing supply arriving 12–18 months out. If you plan to own through 2030 and beyond, today's relative discount may still pay off. If there's any chance you need to sell in 2028 or 2029, the incoming nearby inventory could weigh on your resale price. Be honest about your timeline before you stretch for JFK/UMass.
Is Ashmont and Peabody Square still undervalued?
Ashmont may be the most overlooked of the three.
A walkable village center, Ashmont station, and stronger neighborhood stability than many buyers realize — it's a combination that doesn't get enough credit. School quality matters here, and statewide averages won't tell you what you need to know about Boston Public Schools assignments. Pull the specific BPS school assignment data and recent school-level performance for any address you're seriously considering. Your buyer's agent can help you do that.
For buyers priced out of South Boston or Savin Hill, Ashmont deserves a serious look.
Is Quincy a co-equal option to Dorchester?
For some buyers, yes — and it's worth being direct about that.
The deeper thesis here is transit access over car-dependence, not strictly city over suburb. Quincy — especially Wollaston and North Quincy — has the Red Line, which keeps it in the same conversation.
Where Dorchester still has the edge for specific buyer profiles:
•Buyers who want a two-family with owner-occupant rental income inside Boston city limits
•Buyers who want shorter, single-seat Red Line commutes to Downtown Crossing or Park Street
•Buyers who prioritize Boston neighborhood walkability, particularly village centers like Ashmont and Peabody Square
Where Quincy may win:
•Buyers who want a single-family at a lower price point
•Buyers more comfortable with a suburban property tax structure
This is a genuine choice, not a hierarchy.
Are outer Route 3 South towns losing pricing power?
They're under the most pressure.
Braintree, Randolph, Stoughton — the issue isn't that these towns lack value. They absolutely have it. The problem is the monthly math. When rates are elevated, a larger mortgage combined with commuting costs can erode the "more house for your money" argument. That's especially true for single commuters, hybrid workers, and buyers who don't want a second car.
What are the strongest arguments against this view?
Fair objections exist, and they deserve honest answers.
Do suburbs still offer more space and strong school options?
Yes. For many family buyers, suburbs still make sense — more square footage, more yard, and access to a school district that fits specific needs.
But pricing power is often set by the next buyer at the edge of the market. In 2026, that buyer is frequently rate-constrained and lifestyle-driven. They may not want a longer commute or two cars. They may value a train stop more than a larger yard.
A family with two kids and a Wellesley budget is not the same buyer as a 32-year-old hybrid worker priced out of South Boston. That difference matters when you're trying to read where pricing pressure is actually building.
If suburbs are losing pricing power, shouldn't we see it in their sale prices?
This is the honest concession: there is no suburban-specific sale price or days-on-market data in this article. The hard data here is Boston-proper (Realtor.com neighborhood listings) and citywide (Boston parks data).
The "inner suburbs are losing pricing power" claim should be read as a forward-looking hypothesis — grounded in rate math and observed Dorchester demand, but not a confirmed reading of Middlesex, Norfolk, or Plymouth County sale data.
To pressure-test it before making a decision, ask your agent for three current metrics on Norfolk and Plymouth County: months of supply (how long it would take to sell every home currently listed at the current pace), median days on market, and the percentage of listings with price reductions. Those are the leading indicators that will confirm or refute the hypothesis for your specific town.
Shouldn't new urban supply weaken city pricing?
Only where those units directly compete with what buyers want.
A new luxury rental tower in Seaport doesn't replace a $665,000 Dorchester two-family near the Red Line. Different products, different buyers, different budgets. That said, this cuts both ways for the Greater Boston supply headline. If the new units are mostly non-competing with mid-priced Dorchester homes, the headline number is less relevant to your buying decision than the local pipeline near your target neighborhoods. Watch what's permitted within a half-mile of the station you'd actually use — not what's rising in Seaport.
What should you watch through the rest of 2026?
What should buyers watch in Red Line neighborhoods?
Track active listings in Savin Hill, JFK/UMass, and Ashmont every week. The key isn't just how many homes are listed — it's how many are genuinely good fits for owner-occupants at realistic prices. When that count shrinks, bidding pressure can return quickly.
Why does the Bayside and Columbia Point timeline matter?
Any acceleration into late 2026 could soften pricing around JFK/UMass. More nearby supply gives buyers options, which reduces urgency. If the major delivery stays in 2027–2028, current buyers with a long hold horizon may still come out ahead. Short-horizon buyers should price this risk into their offer.
Why does the November 2026 rent control ballot matter?
The November 2026 statewide rent control ballot is the biggest policy wildcard on the horizon — and it's genuinely two-sided for a Dorchester buyer.
The downside: Worcester officials have publicly projected meaningful property-value losses under a proposed cap, along with a sizable residential tax rate hike to offset those losses (per Telegram & Gazette reporting in 2026). A dense, multifamily-heavy market like Dorchester would be among the most exposed to rent regulation.
The upside for existing owners: Cambridge had rent control from 1970 until voters repealed it in 1994. MIT researchers studied that period and found that new multifamily construction and investment moved in the opposite direction of the cap (Autor, Palmer & Pathak, MIT, 2014). Other rent-controlled markets have shown similar permit slowdowns. For someone who already owns a Dorchester two-family before a law takes effect, a supply freeze on new competing units could increase scarcity premiums on existing homes.
What this means for a 2026 buyer: If you're purchasing a Dorchester multifamily expecting to charge market rents, the downside risk is real — underwrite a scenario where rent growth is capped. If you're buying primarily as an owner-occupant in a single-family or owner-occupied two-family, your exposure may be more limited. Many small multifamilies are typically exempted under proposed Massachusetts frameworks. Read the actual ballot language carefully before closing, and ask your attorney how it would treat owner-occupied 2–4 unit properties.
This isn't a clean "rent control equals bad for buyers" story. It's a "know which side of the trade you're on" story.
Should you wait for mortgage rates to drop?
At 6.61% (Freddie Mac PMMS, 2026), rates look sticky in the near term. A sudden rate-driven competition surge is unlikely this quarter, which removes one common reason to rush.
The case against waiting indefinitely, though, isn't about rates — it's about inventory absorption. In Dorchester, the well-priced, well-located listings are the ones that move. If you find the right home at a payment you can handle today, waiting for a better rate that may not arrive on your schedule could simply cost you that specific property.
Buy the home, not the rate forecast.
What is the June 2026 takeaway for Greater Boston housing?
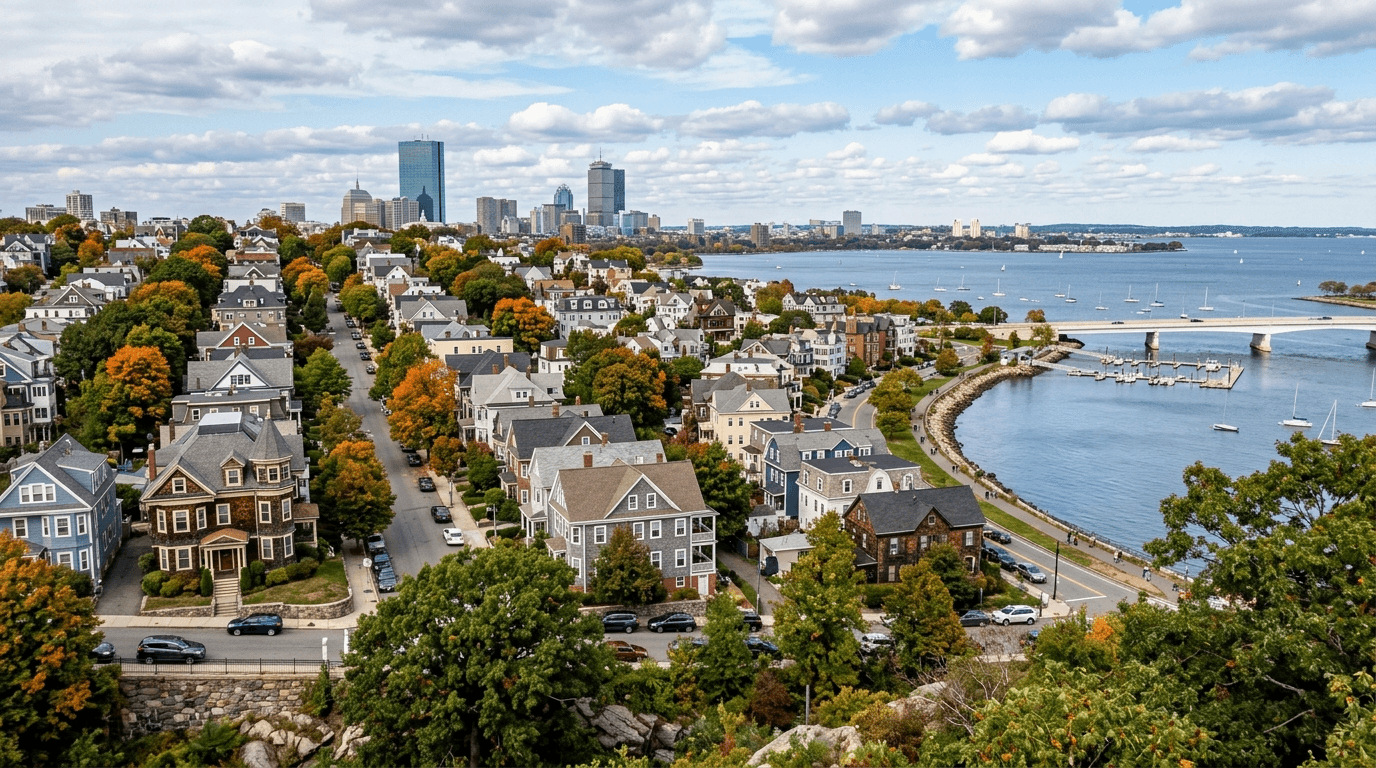
Greater Boston's recent multifamily wave is real. It did not land evenly. And it did not fully relieve pressure in the places many buyers want most: walkable, transit-connected, mid-priced neighborhoods.
That's why Savin Hill, JFK/UMass, and Ashmont Dorchester are still holding pricing power. They offer a rare combination right now:
•Red Line access
•Walkability
•Relative affordability at a $665,000 median — below Jamaica Plain ($847K) and East Boston ($687K)
•Owner-occupant demand
•Limited new competing supply nearby, for now
Outer commuter suburbs aren't disappearing. Some are losing the buyer who once stretched for more space and accepted the longer commute. There's no suburban sale-price data in hand to prove that yet — treat it as a working hypothesis and verify it against current Norfolk/Plymouth County metrics before acting.
One quote from a seller captures the dynamic precisely:
"Savin Hill too. I miss the years on Neponset Ave — prices drove me out."
The same market that pushed that homeowner out is still pulling new buyers in.
Don't confuse a Greater Boston supply headline with what's happening on your block. If you want to know whether your specific neighborhood is gaining or losing pricing power, get a street-level read before you buy or list. In this market, the block matters more than the headline.