Current trends, pricing data, and expert analysis across Newton and the surrounding Greater Boston communities.
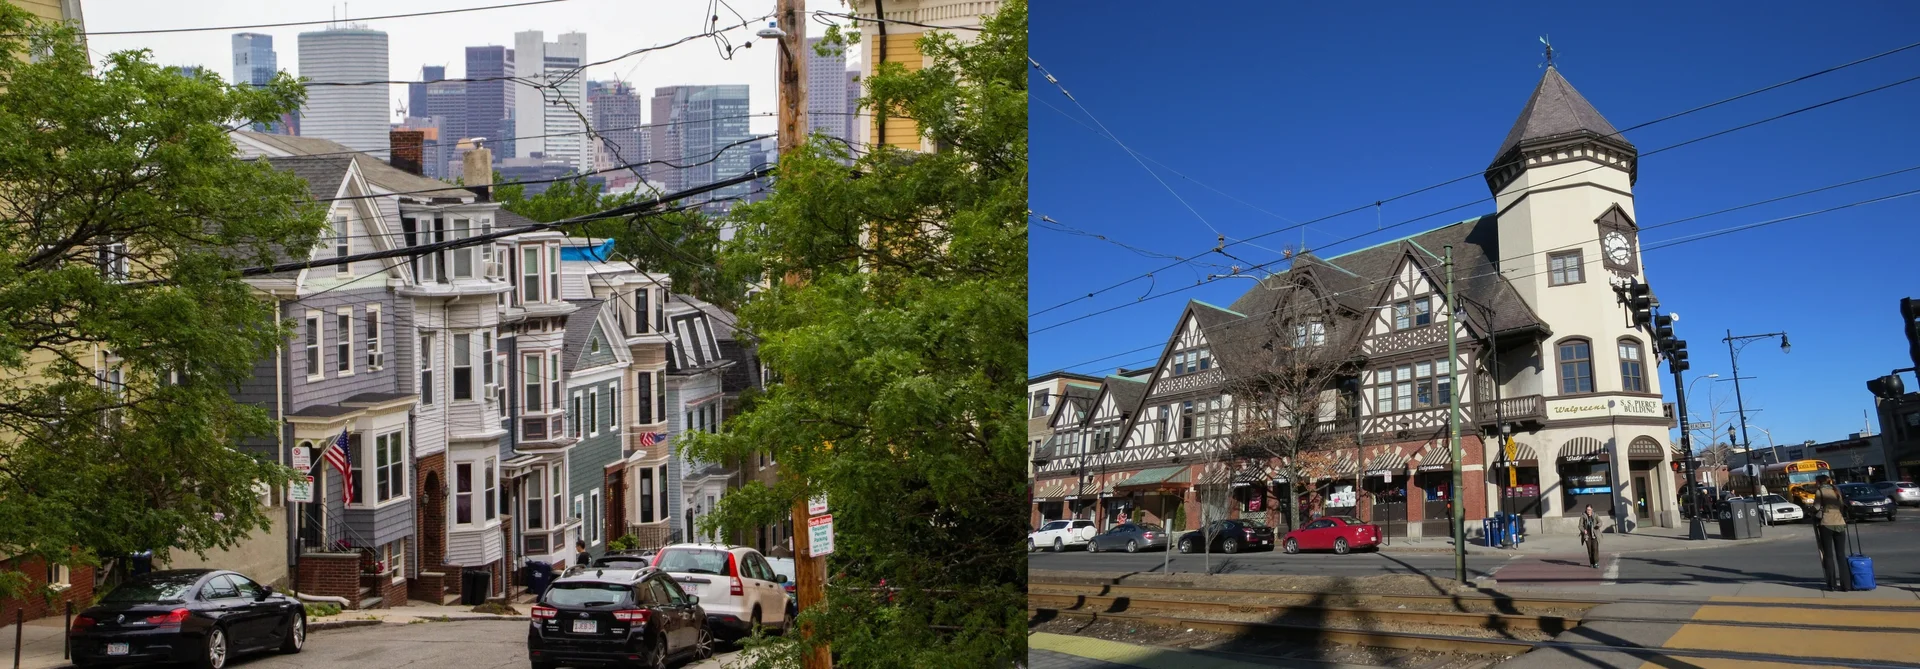
Southie sells in ~33 days while Back Bay lingers near ~64. Learn what this means for buyers—speed vs price, leverage, and tactics to win.
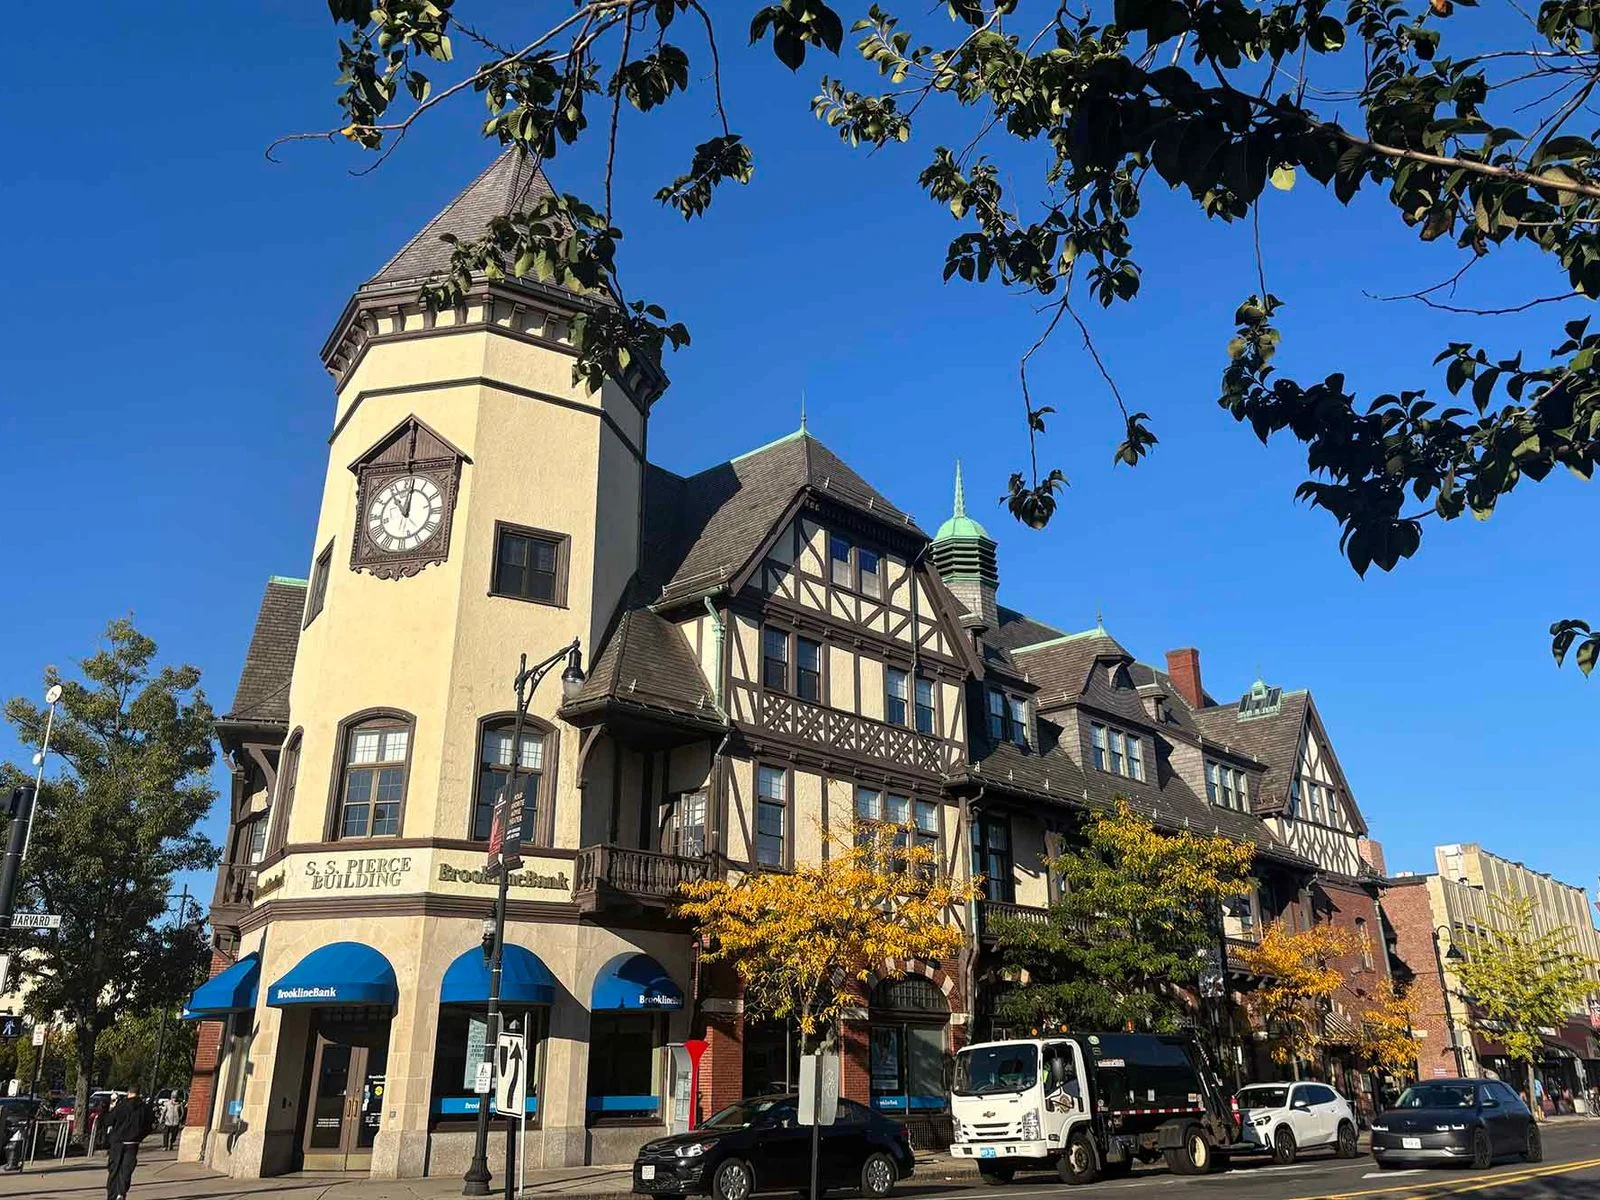
Boston’s luxury condo glut is cooling prices while Brookline’s extreme scarcity drives a +21.9% jump. See what it means for buyers and owners in 2026.
Packed Newton open houses can be “tourist traffic.” See why February buzz isn’t translating into sales—and what buyers and sellers should watch instead.
Boston inventory is up 16.2%, yet pendings jumped 9.2%. Learn why “more homes” still feels scarce—and how to win the fresh listings.
National inventory is up, but Greater Boston still has almost no $500K move-in-ready single-family homes. See what to buy instead in 2026.
Why Wellesley prices stay rigid while Newton opens negotiation windows. Learn how February 2026 inventory waves can create buyer leverage.
In Boston’s Feb 2026 market, leased solar panels can act like a $20K–$30K encumbrance—adding friction, scaring buyers, and dragging offers down.
63.5% of Boston-area homes are selling under ask in Feb ’26. Learn what’s driving it—and how to price (or buy) without a bidding war.
A 3% rent cap could make 38% of projects infeasible—erasing 16,629 future units and worsening Boston’s housing crunch. See the math.
Boston inventory is tight, but 2026 leverage is in re-listed condos after late-2025 failures. Learn how to spot shadow inventory and negotiate.
A Needham home sat 142 days—then sold over list. See how the “Inventory Vacuum Floor” is reshaping days on market, pricing, and buyer strategy.
Think Newton’s taxes match Wellesley or Belmont? The headline rate tells a different story—see why Newton’s FY2024 rate stands out.