Current trends, pricing data, and expert analysis across Newton and the surrounding Greater Boston communities.
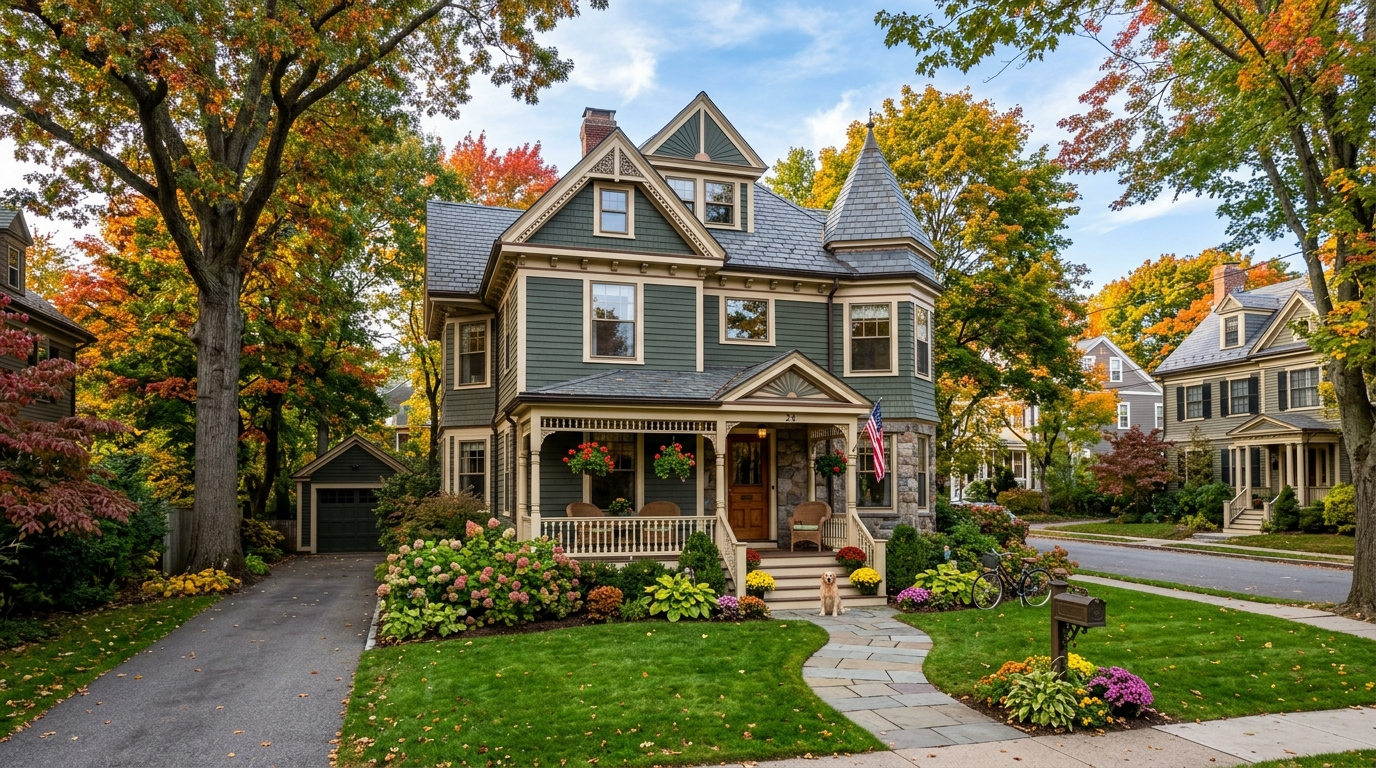
Brookline strategy for June: price to recent comps, write cleaner offers, and note single-family median sold price at $3,170,000.
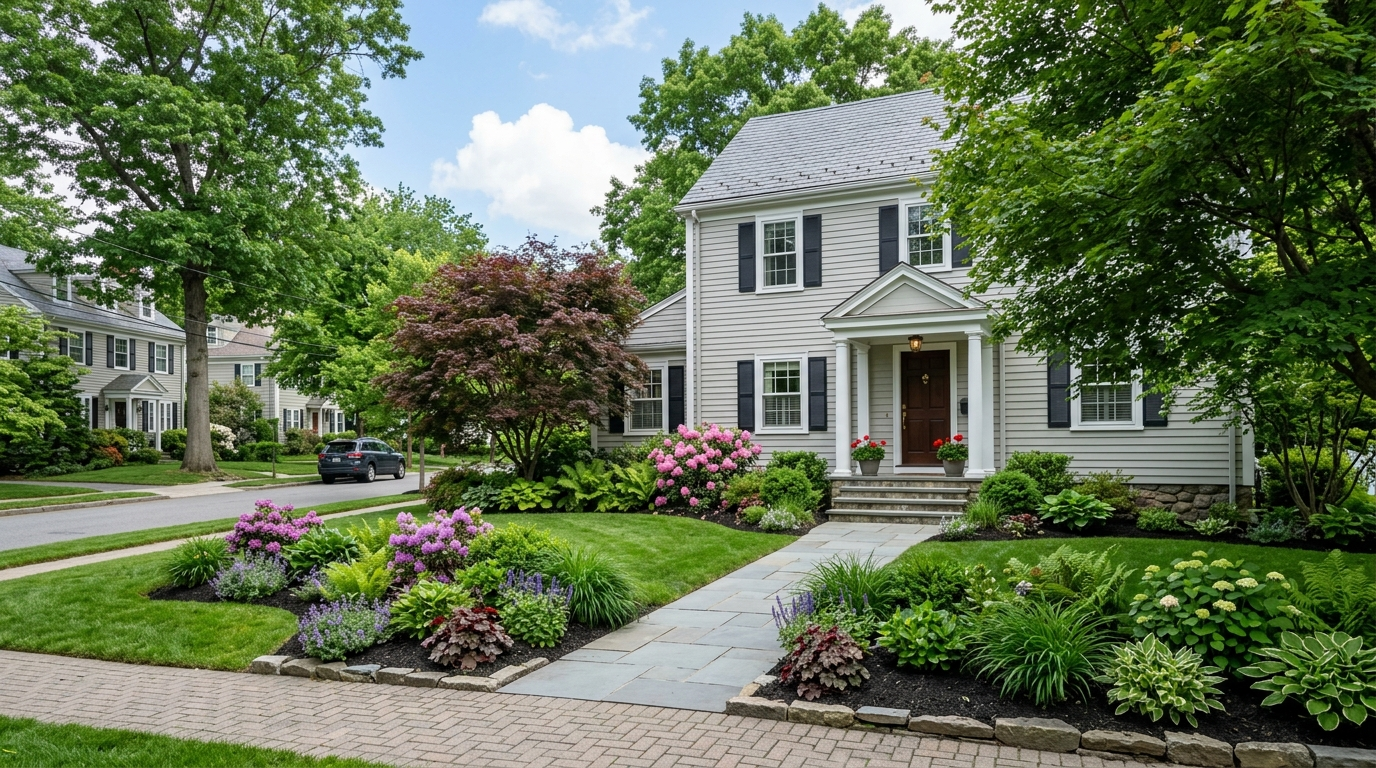
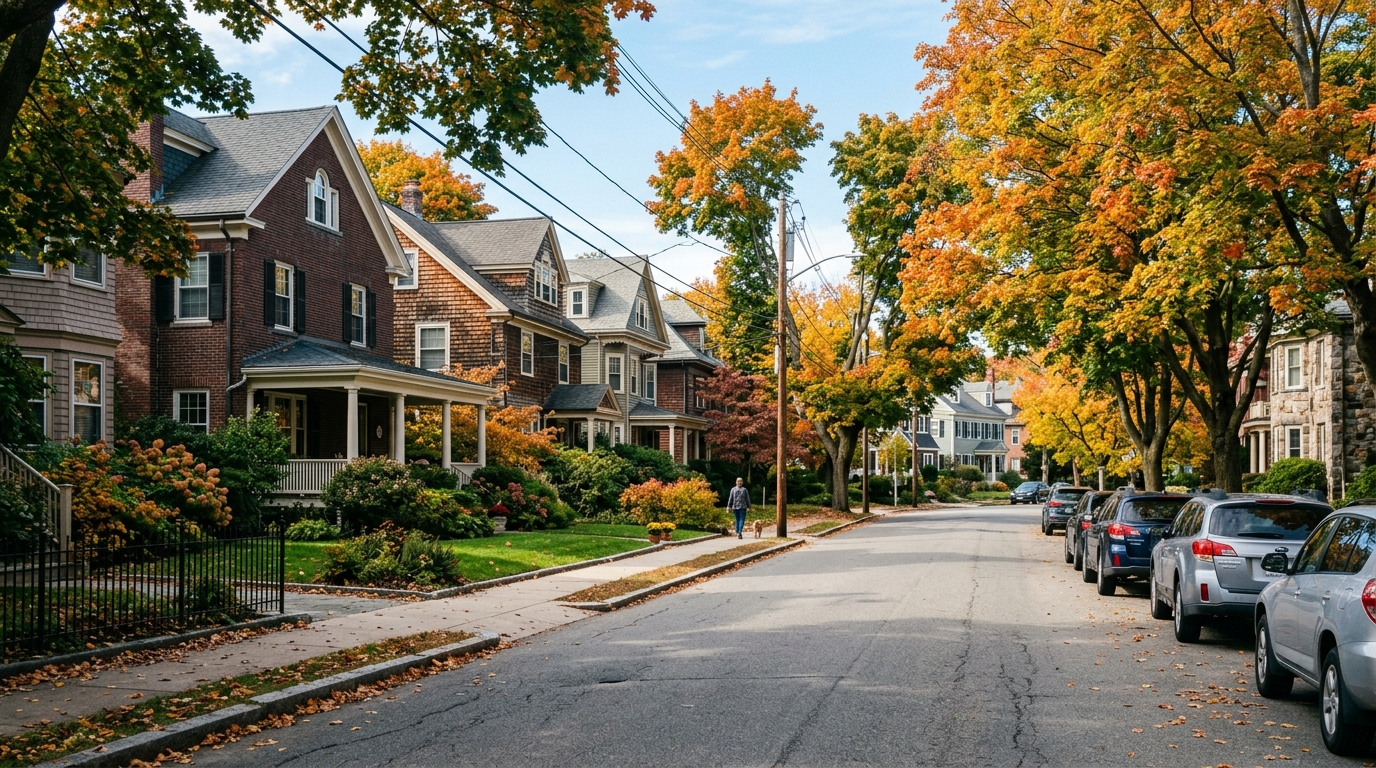
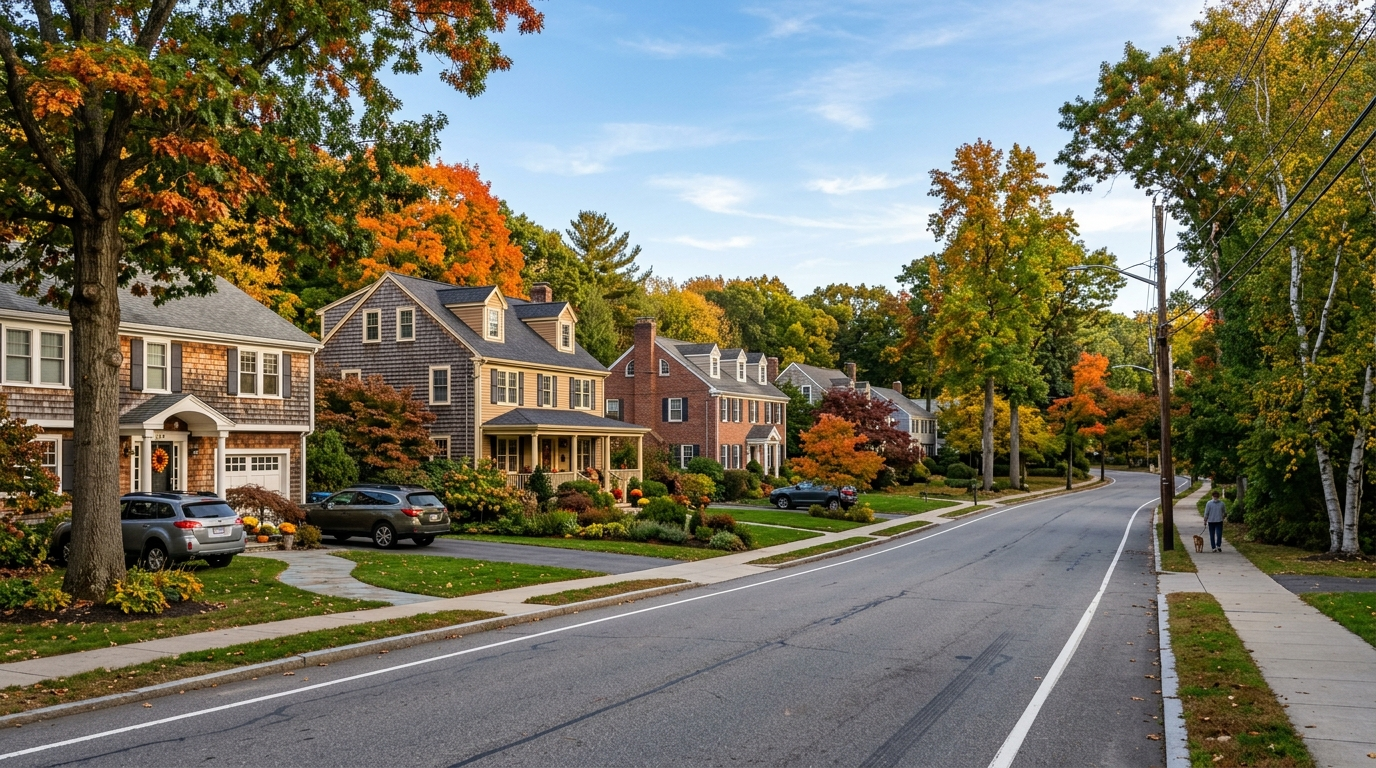
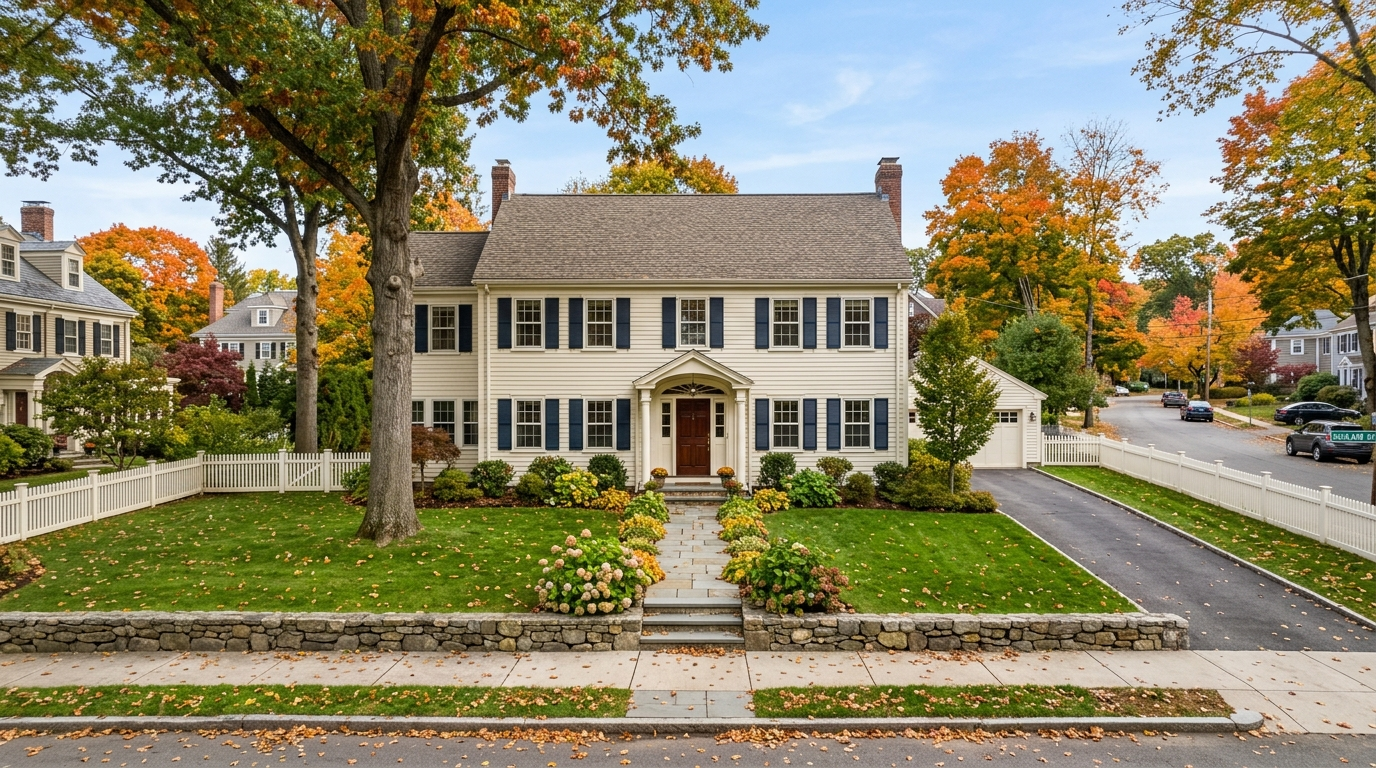
Newton homes sell at a 100.8% sale-to-list ratio, but buyers still have leverage. See why curb appeal can help protect your asking price.
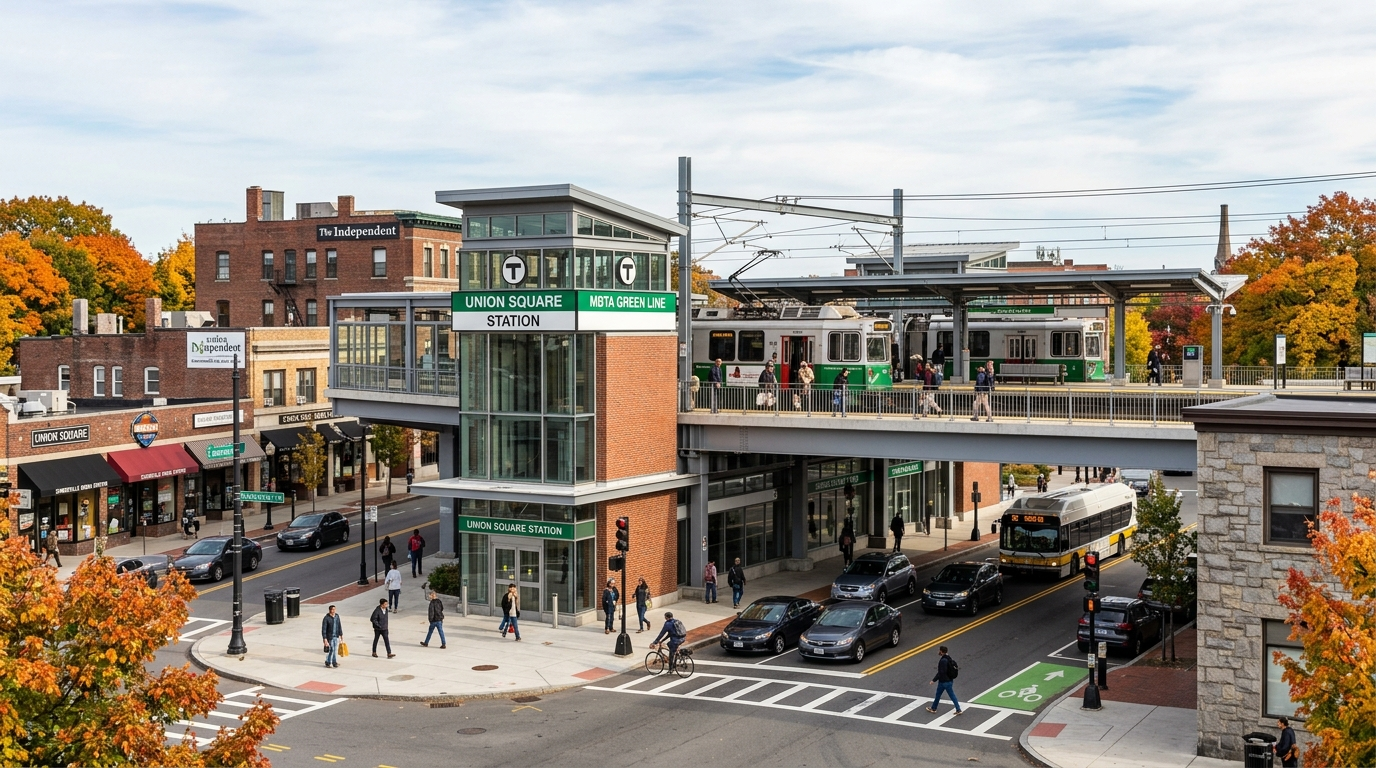
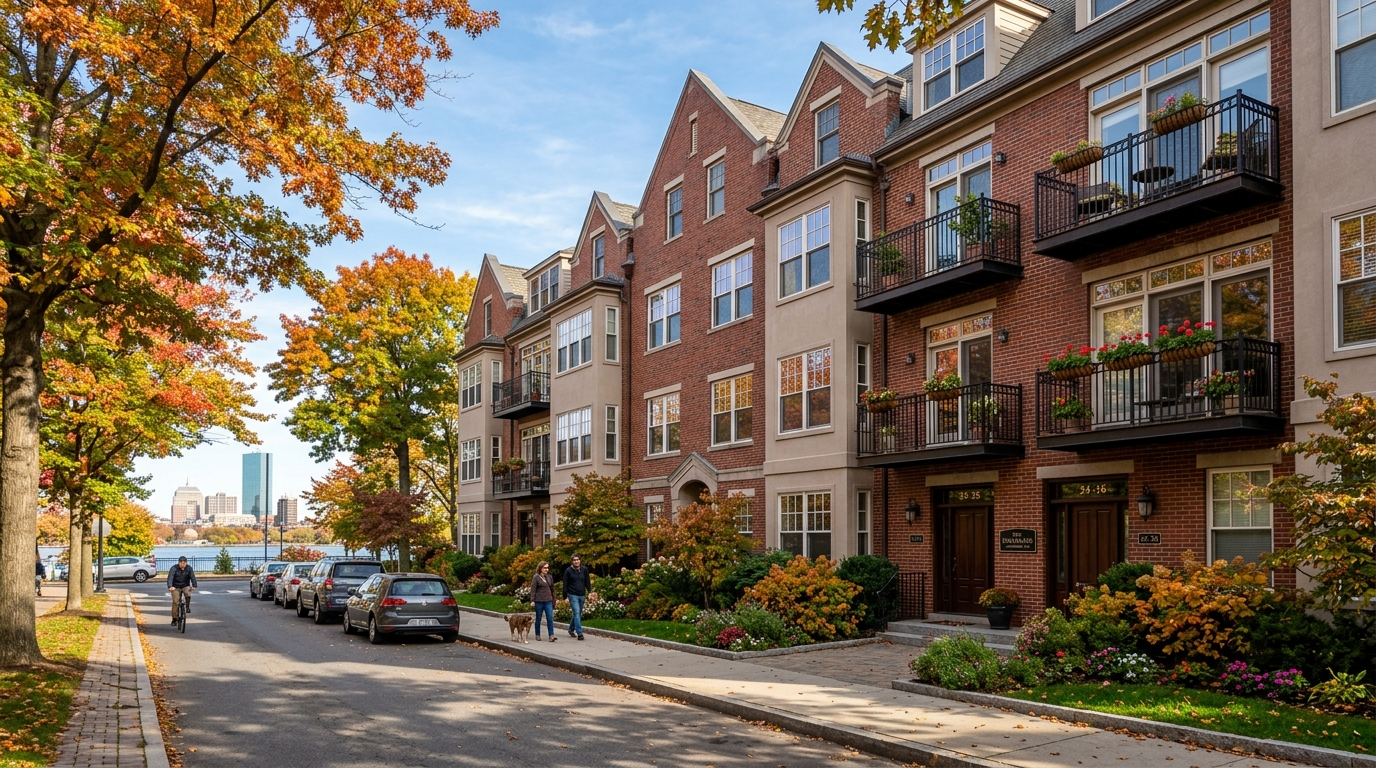
Compare Davis Square, Union Square and North Point through Somerville assessment context, parcel data, exemptions and tax-bill math.
In Needham’s $1.7M market, sellers should match recent comps by condition and location before pricing a turnkey or fixer home.
Newton’s FY2026 residential tax rate is $9.69 per $1,000, but buyers still need the assessor card to estimate real holding costs.
Brookline sellers: townwide medians can mislead. Use school-zone comps, property type, and days on market to set a defensible list price.
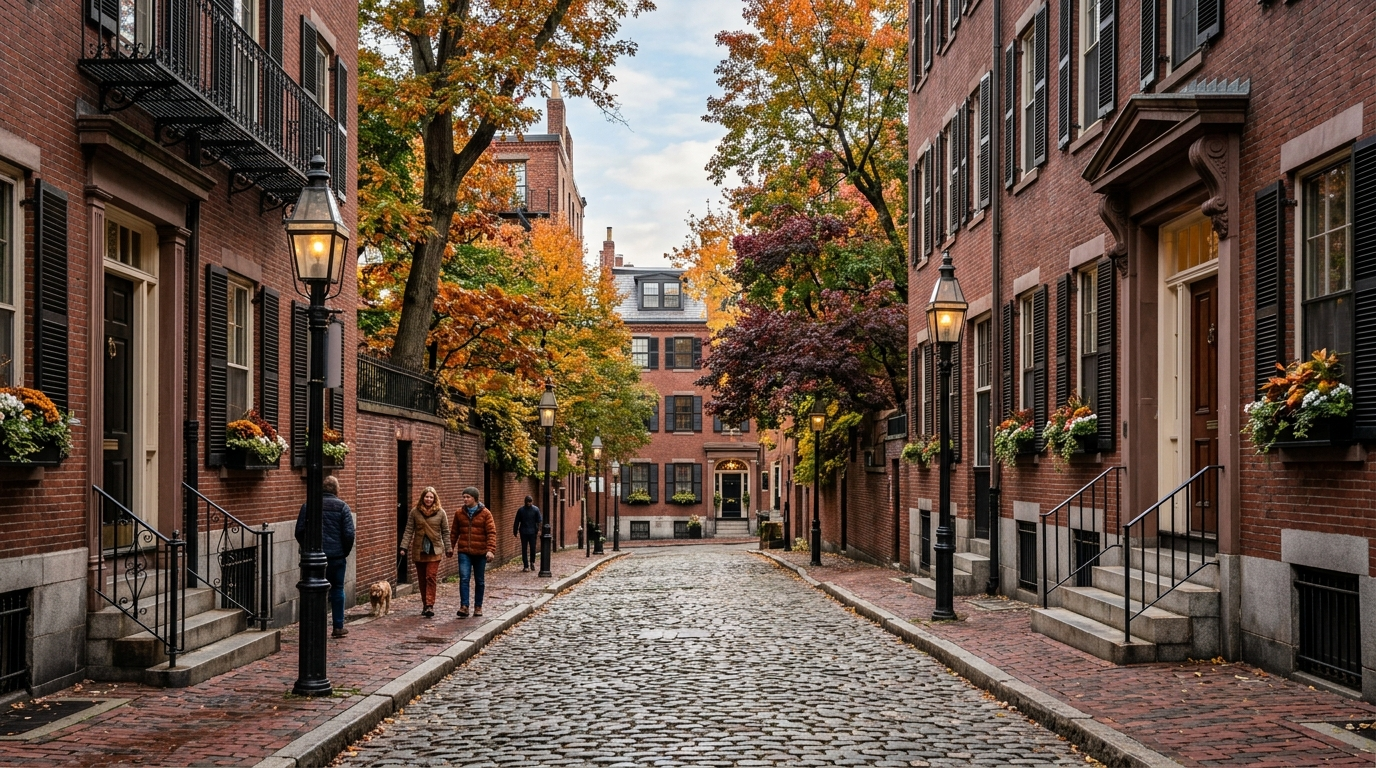
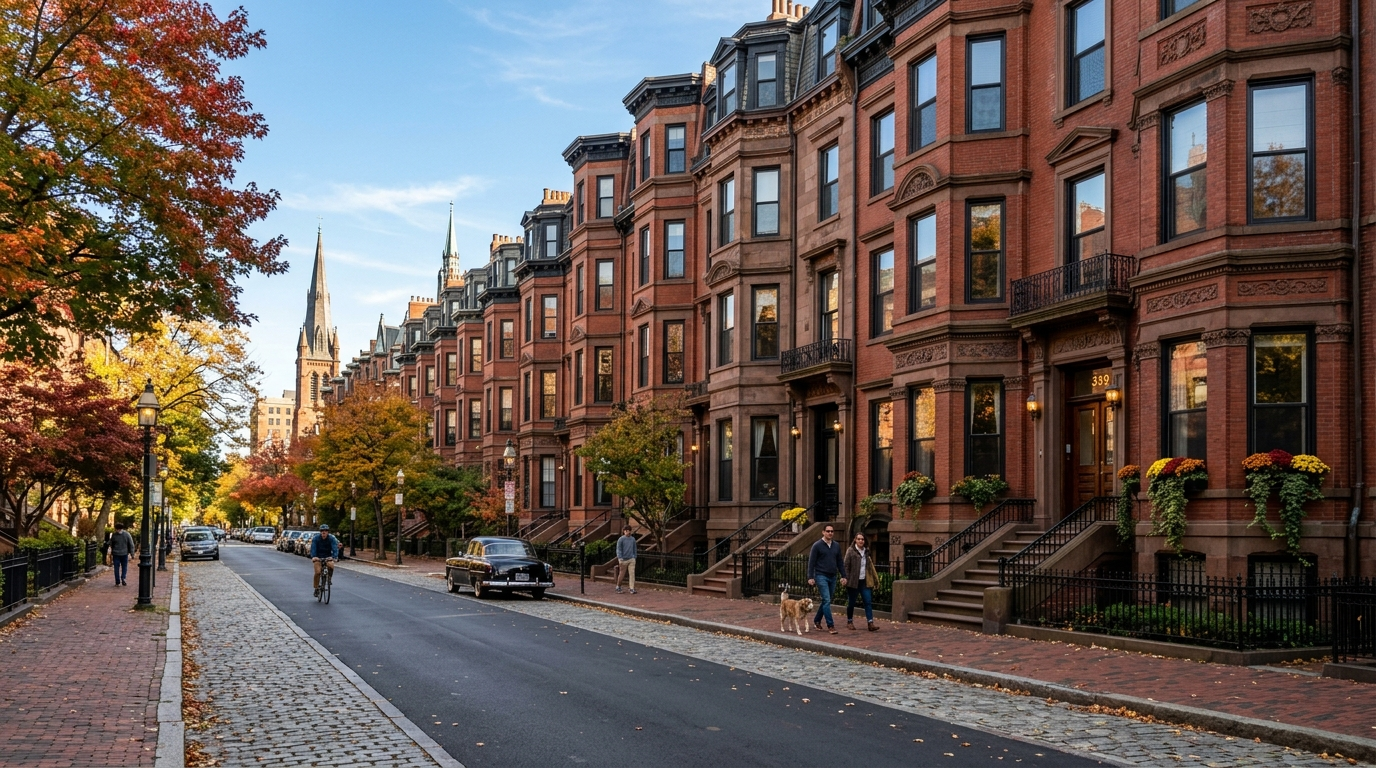
See why Beacon Hill and Back Bay stand out for walkability, food, old-city charm, and lasting appeal in Boston’s core downtown market.
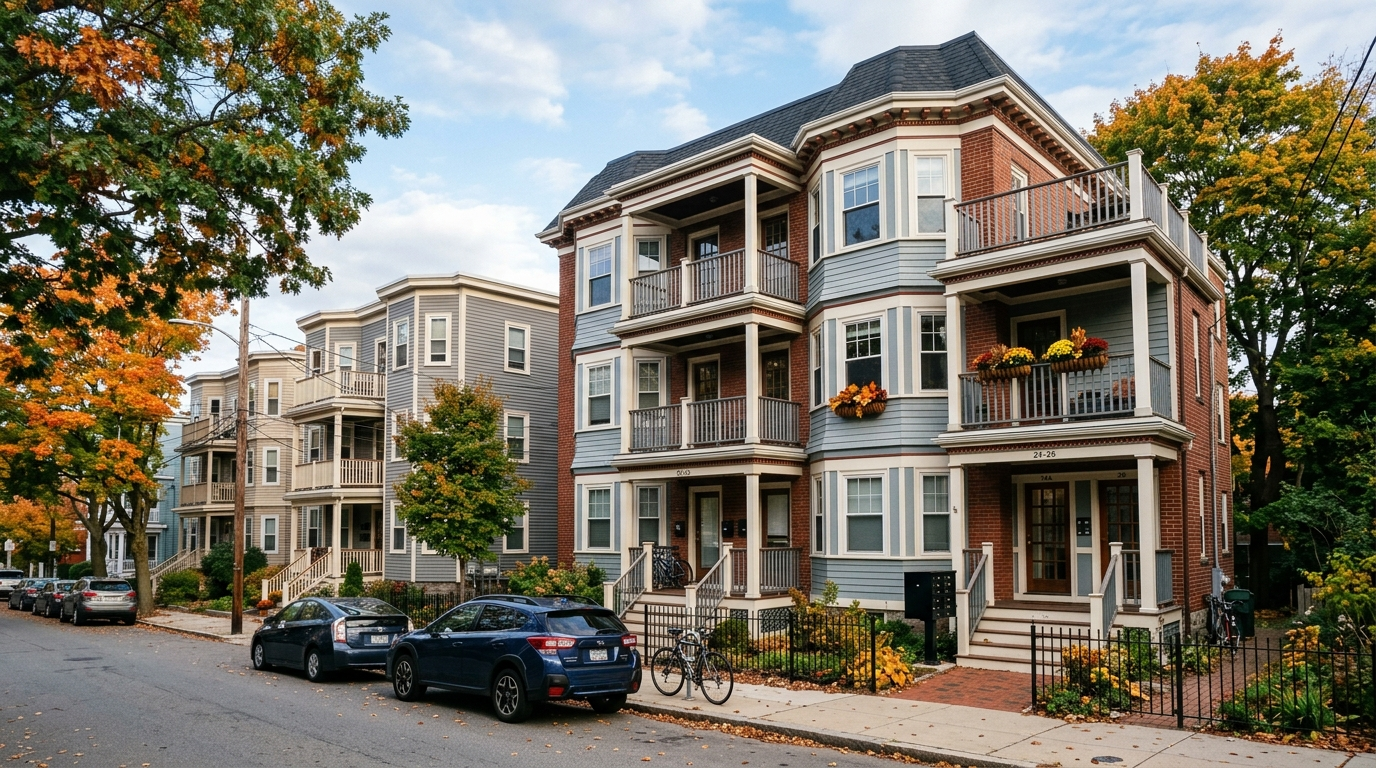
In Cambridge, condos and multi-family homes are selling below list—see how buyers can keep financing, appraisal, and inspection protections.
See why Somerville’s median can mislead buyers as sales mix shifts, condo listings shrink, and price per square foot eases by segment.
See how Back Bay, Fenway–Kenmore and property types show why Boston home prices vary by neighborhood—not one citywide average.
Why buyers pay more for Needham homes: schools, scarcity, resale confidence, and the lifestyle trade-offs versus Newton, Dedham, and Westwood.
Newton Highlands median sale price fell 14.5%, but price per square foot rose 18.2%. See what buyers and sellers should read now.