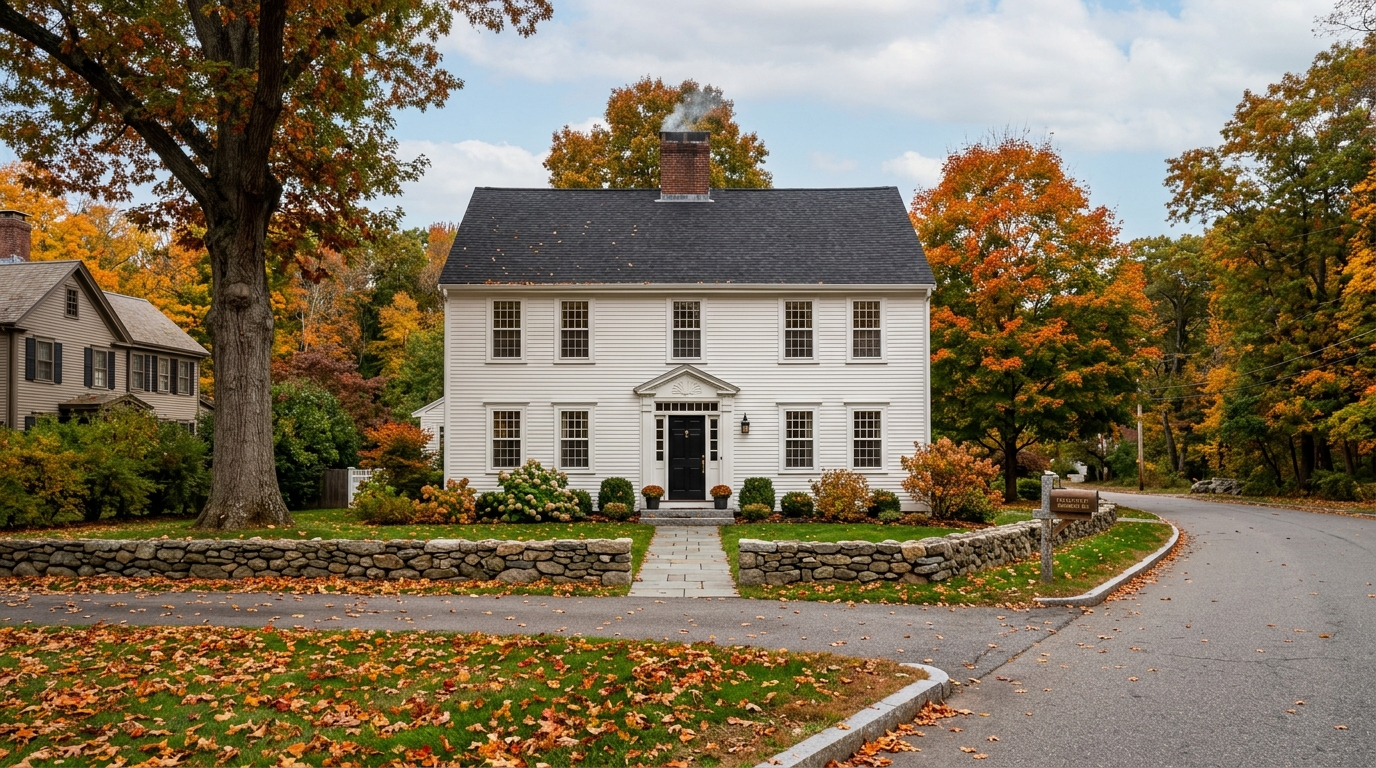
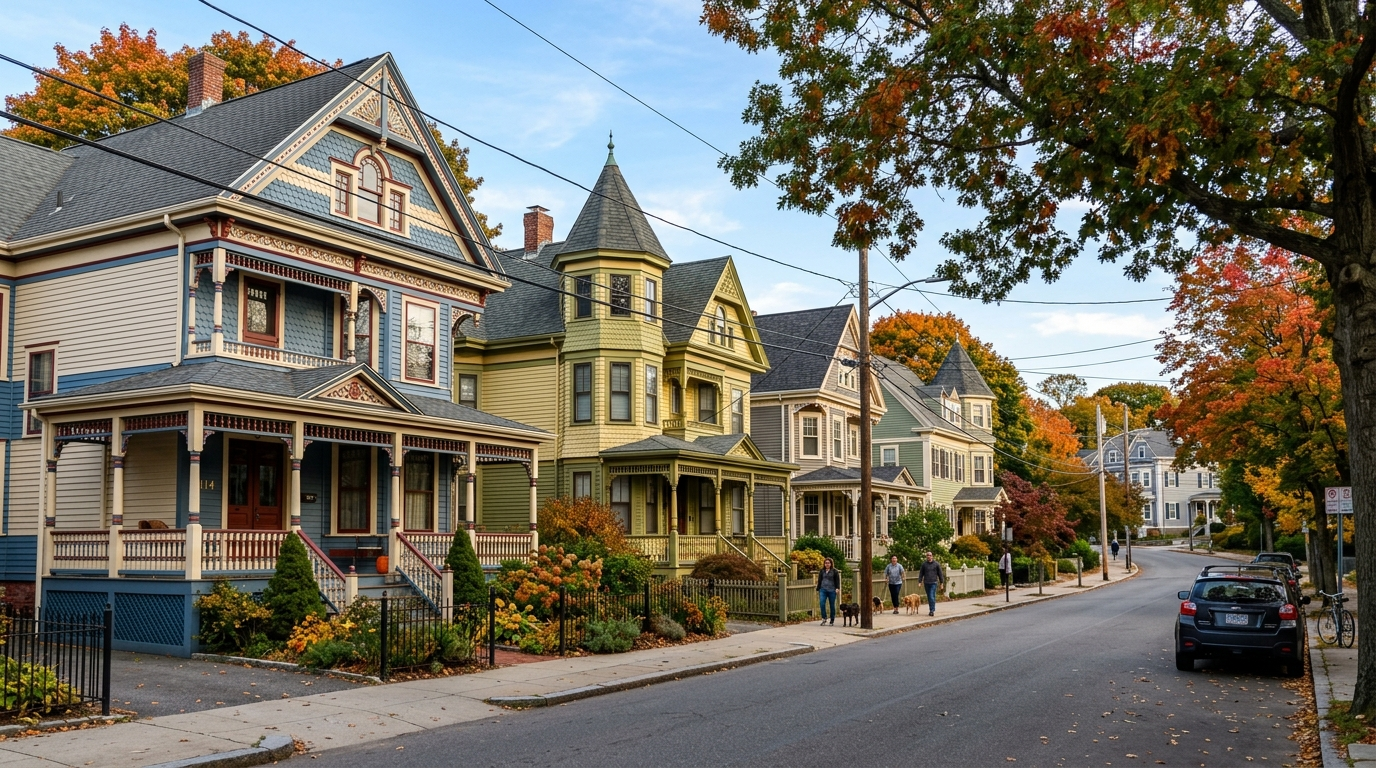
Current trends, pricing data, and expert analysis across Newton and the surrounding Greater Boston communities.
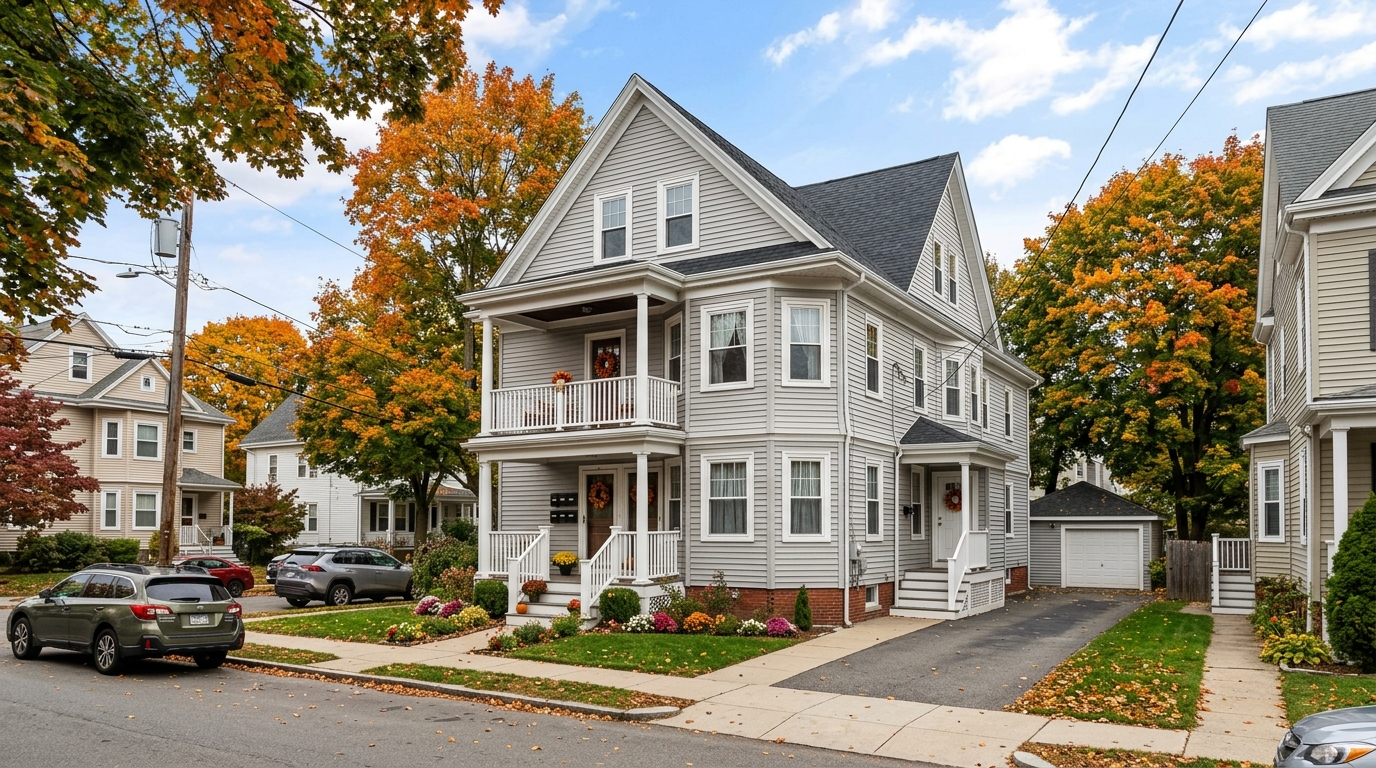
Medford condos take 42 days to offer while single-family homes take 22. See what the property-type split means for buyers and sellers.
June 2026 recently sold homes in Needham MA show single-family listings moving in 20 days while condos took 92—why “balanced” may mislead.
Boston homeowners face a 13% property tax increase, showing how office-value declines can shift costs in commercial-heavy MA cities.
Explore East Boston’s waterfront appeal on a Boston neighborhoods map, with context from citywide inventory and neighborhood price charts.
It's easy to think Newton's FY2026 tax rate cut is a win for every buyer equally — a lower mill rate, more money in your pocket, done. But wait. A flat rate cut
See why Massachusetts tax bills can rise under Prop 2½, with FY2026 average single-family bills at $8,113.
Cambridge’s $6.67 residential rate can still mean very different bills by ZIP. Learn what to verify before you bid.
See Boston neighborhoods by price tier, from Reach to Starter-Friendly pockets like Brighton, Dorchester, Roslindale, and East Boston.
See why lot size, build era, and matched Needham Heights sales matter more than townwide medians when pricing or appealing a home.
Most people think $1 million buys luxury anywhere in Massachusetts. But here's the uncomfortable truth — drop that budget in Cambridge or Newton and you're bare
Buying in Needham? See why a $1.5M home starts near $16,245 in taxes—and why the 7.52% bill increase matters for your budget.
Post-reval Somerville buyers are selective. Learn why pricing to market—not your assessment—helps avoid stale listings and lost leverage.